The Derivation of Entropy’s Increase and Time’s Arrow from the McGucken Principle of a Fourth Expanding Dimension dx4/dt=ic. A deeper connection between Brownian Motion’s Random Walk, Feynman’s Many Paths, Increasing Entropy, and Huygens’ Principle.
The Derivation of Entropy’s Increase from the McGucken Principle of a Fourth Expanding Dimension dx4/dt=ic. A deeper connection between Brownian Motion, Feynman’s Many Paths, Increasing Entropy, and Huygens’ Principle.
Consider a universe wherein the fourth dimension x4 is expanding at the rate of c as given by Einstein’s/Minkowski’s x4=ict and McGucken’s dx4/dt=ic.
As all particles exist in part in the fourth dimension, they are dragged along by its expansion, and thus given initial conditions wherein twenty particles are equally distributed on a circle, the entropy of the system will naturally increase over time as shown in the below discussion.
Postulate: The fourth dimension is expanding at the rate of c in a spherically-symmetric manner, and thus after a given time t, a particle has equal chance of being found anywhere upon a sphere correlated with the fourth dimension’s expansion, centered about the particle’s previous position. So it is that the fourth dimension’s expansion leads to entropy’s increase.
Entropy’s Increase via the Expansion of the Fourth Dimension
Draw the figure : consider twenty particles arranged equally in a circle of radius r at t=0. at one second later, each particle will be found in a new place defined by a random place on a circle of radius t*r centered about each particles original position, where t is time and r is the original radius. draw this for the first three seconds. Each particle moves r during each iteration. calculate the entropy for each step.
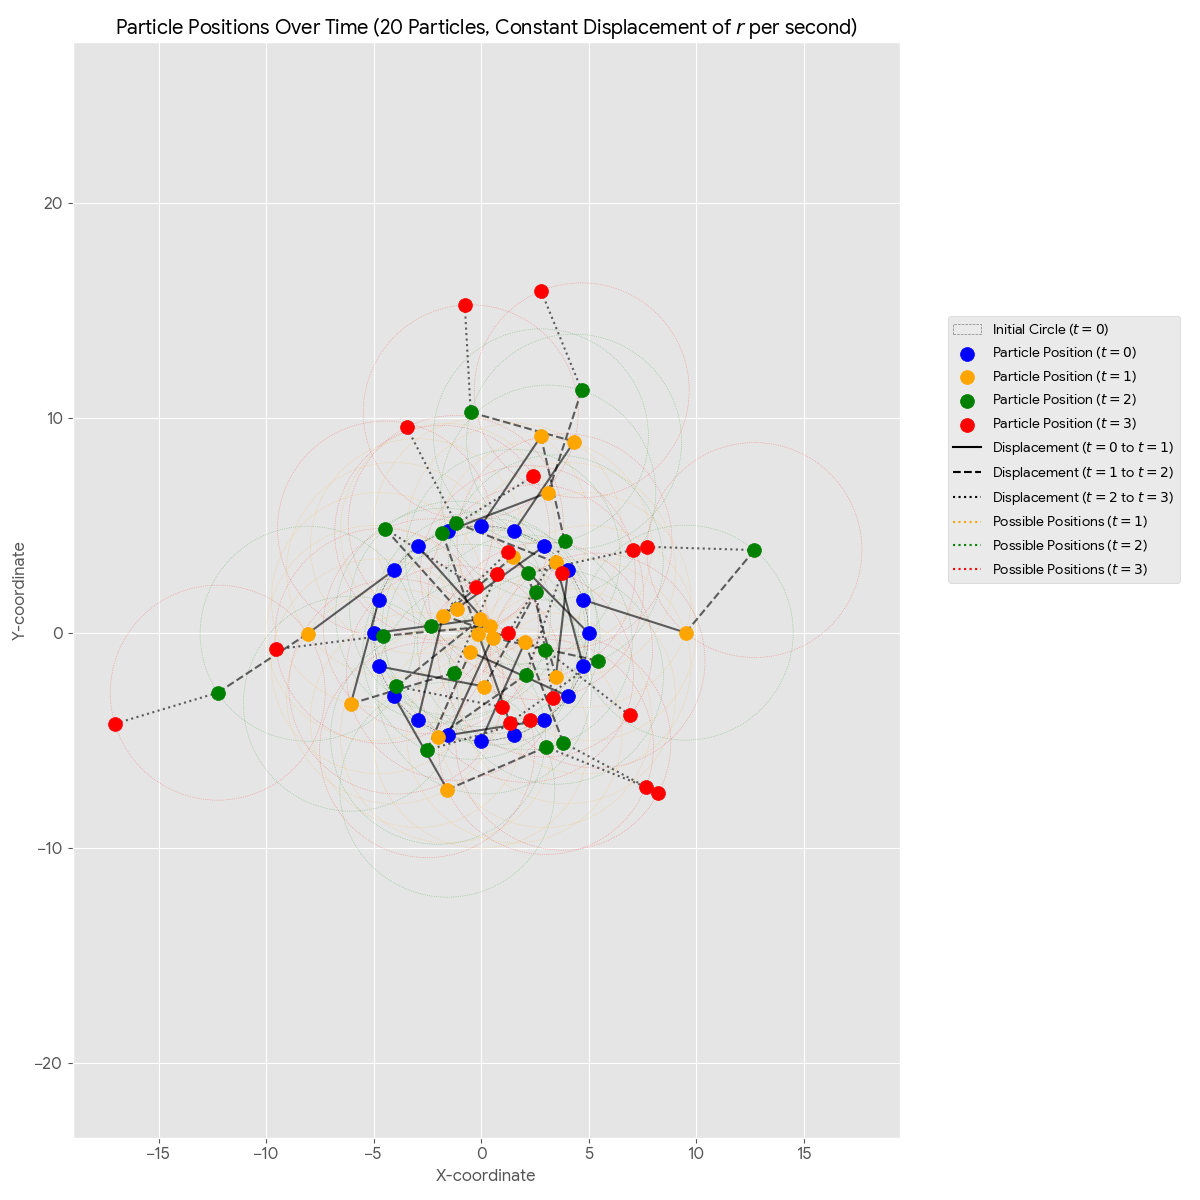
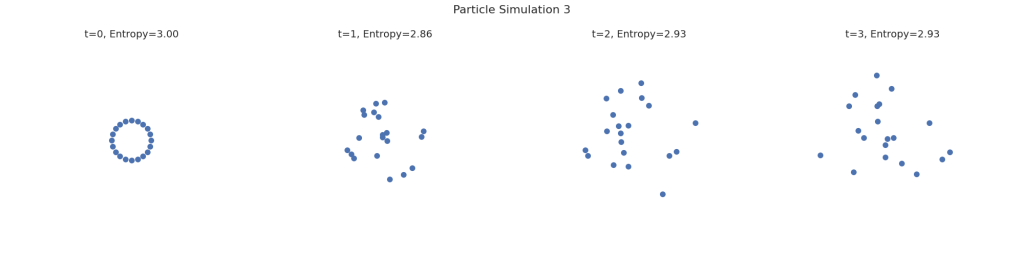
The image above shows the positions of twenty particles at four different time points: t=0, t=1, t=2, and t=3. The particles begin by being evenly distributed on a circle of radius r, represented by the blue points, and entropy increases over time.
In this scenario, each particle moves a distance of exactly r from its former position at each second, as it is dragged by the expansion of the fourth dimension. As the fourth dimension expands in a spherically-symmetric manner, each particle may be found anywhere upon a circle of radius r (cnetered about the particle’s previous position) with equal probability.
The blue points show the initial positions of the particles at t=0 on the dashed gray circle.
The orange points show the random new positions of the particles at t=1. Each of these positions is on a circle of radius r centered on its original t=0 position.
The green points show the random new positions of the particles at t=2. Each of these positions is on a circle of radius r centered on its t=1 position.
The red points show the random new positions of the particles at t=3. Each of these positions is on a circle of radius r centered on its t=2 position.
The solid black line shows the displacement from the t=0 position to the t=1 position. The dashed black line shows the displacement from the t=1 position to the t=2 position. The dotted black line shows the displacement from the t=2 position to the t=3 position.
Entropy Calculation
The entropy for each step of the particle movement can be measured by calculating the mean squared displacement (MSD), which quantifies the average spread of the particles from their initial positions over time.
Based on the particle movement simulation, the calculated entropy (MSD) for each time step is as follows:
Entropy at t=1: 25.00
Entropy at t=2: 47.01
Entropy at t=3: 75.46
The increasing values of the entropy over time indicate that the particles are spreading out and the system is becoming more disordered with each passing second, which is expected given the random nature of the movement.
Let us run the simulation again, and we see the entropy again increases:
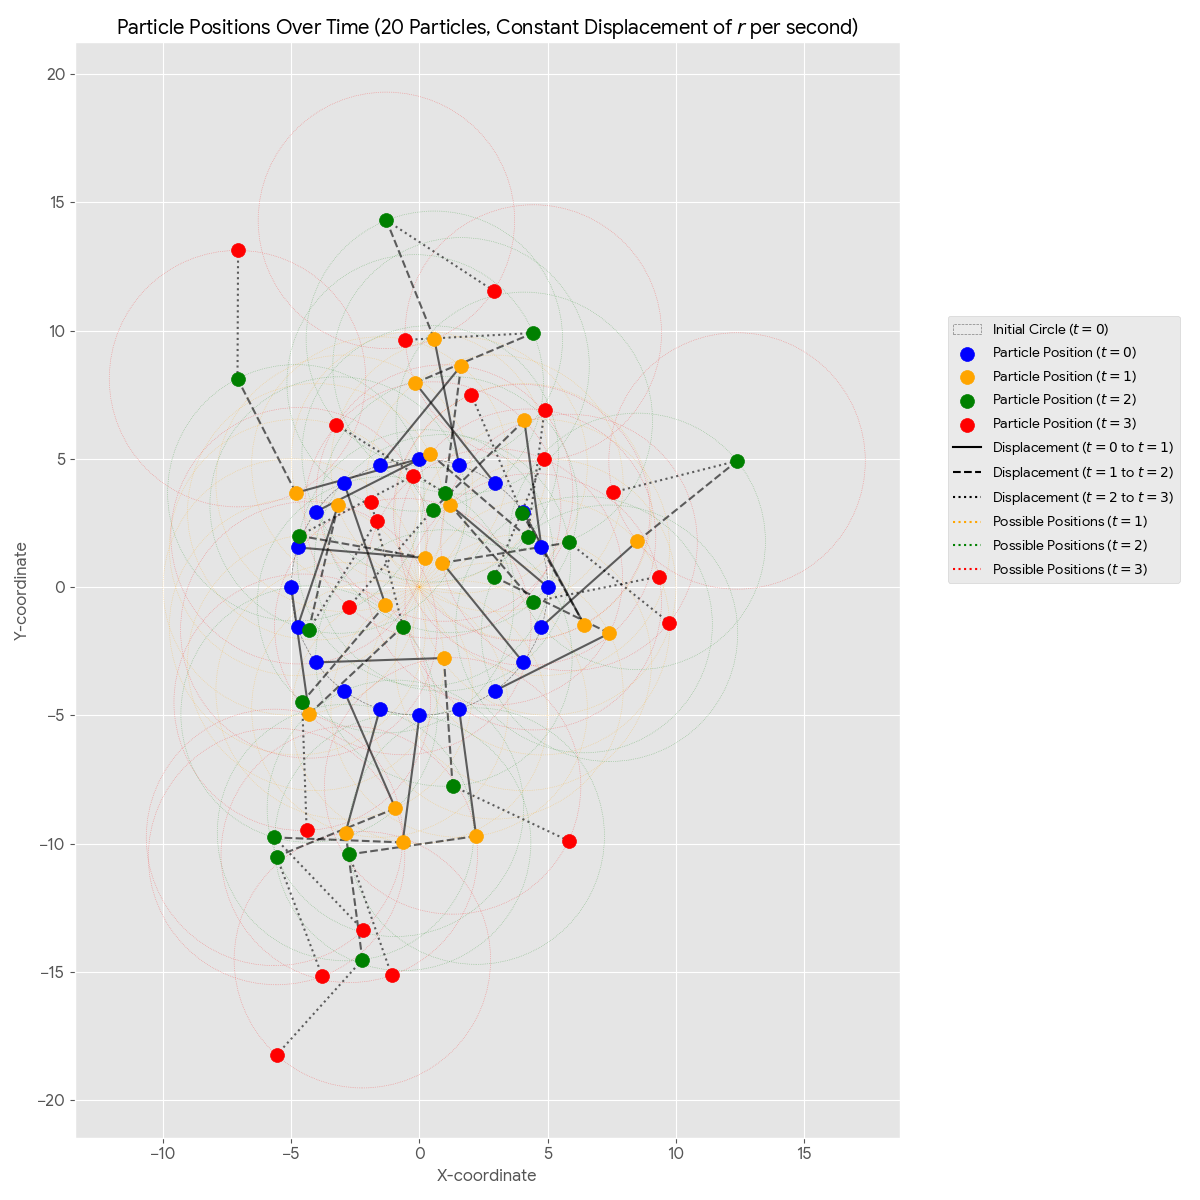
The above image shows the positions of twenty particles at four different time points: t=0, t=1, t=2, and t=3. Again, in this scenario, each particle moves a distance of exactly r from its former position at each second, as it is dragged by the expansion of the fourth dimension. As the fourth dimension expands in a spherically-symmetric manner, each particle may be found anywhere upon a circle of radius r with equal probability.
In this scenario, each particle moves a distance of exactly r at each second, with the direction being random, from its previous position.
The blue points show the initial positions of the particles at t=0 on the dashed gray circle.
The orange points show the random new positions of the particles at t=1. Each of these positions is on a circle of radius r centered on its original t=0 position.
The green points show the random new positions of the particles at t=2. Each of these positions is on a circle of radius r centered on its t=1 position.
The red points show the random new positions of the particles at t=3. Each of these positions is on a circle of radius r centered on its t=2 position.
The solid black line shows the displacement from the t=0 position to the t=1 position. The dashed black line shows the displacement from the t=1 position to the t=2 position. The dotted black line shows the displacement from the t=2 position to the t=3 position.
Entropy Calculation
The entropy for each step of the particle movement can be measured by calculating the mean squared displacement (MSD), which quantifies the average spread of the particles from their initial positions over time.
Based on the particle movement simulation, the calculated entropy (MSD) for each time step is as follows:
Entropy at t=1: 25.00
Entropy at t=2: 41.84
Entropy at t=3: 74.40
The increasing values of the entropy over time indicate that the particles are spreading out and the system is becoming more disordered with each passing second, which is expected given the random nature of the movement.
Entropy Always Increases:
The following are the results from the five independent trials:
Trial 1
Entropy at t=1: 25.00
Entropy at t=2: 32.16
Entropy at t=3: 49.34
Trial 2
Entropy at t=1: 25.00
Entropy at t=2: 47.55
Entropy at t=3: 70.91
Trial 3
Entropy at t=1: 25.00
Entropy at t=2: 47.93
Entropy at t=3: 76.00
Trial 4
Entropy at t=1: 25.00
Entropy at t=2: 41.54
Entropy at t=3: 78.22
Trial 5
Entropy at t=1: 25.00
Entropy at t=2: 57.96
Entropy at t=3: 103.13
So it is that the expansion of the fourth of dimension at the rate of c be be seen to underlie the physical reality that entropy always increases.
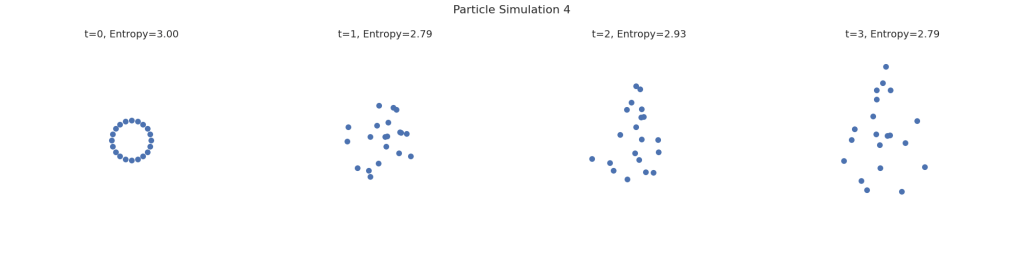
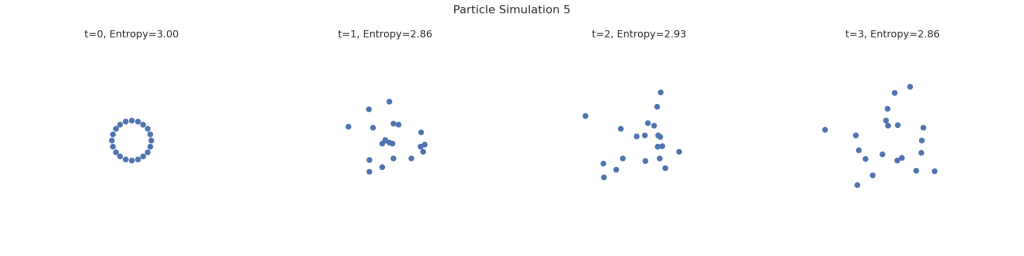
For further illustration, let us also run this simulation five times visually:
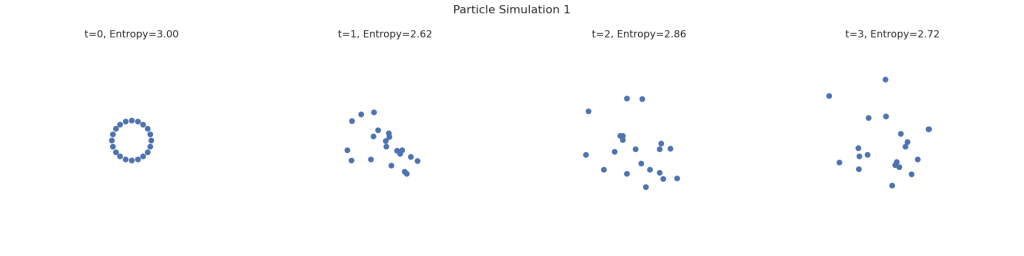
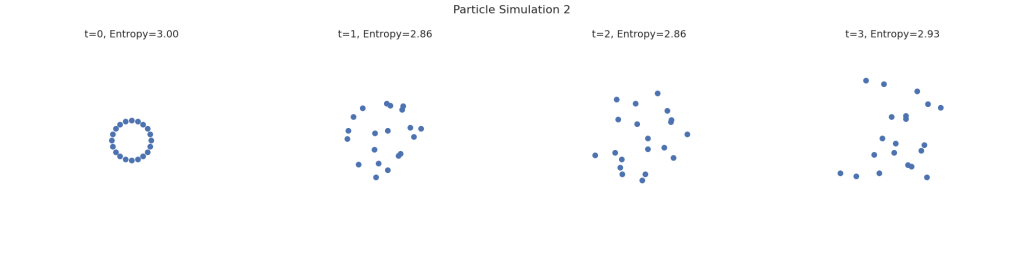

Leave a comment